Select  on the Map Toolbar to change the appearance of your features.
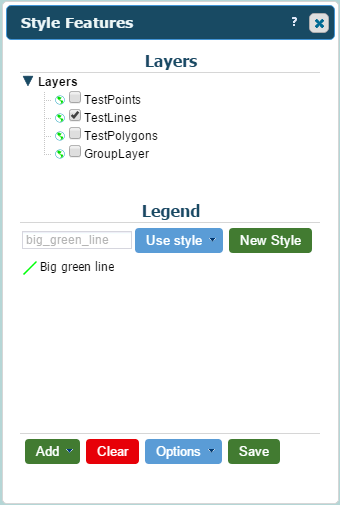
Here is the Style Features Window. Select the layer you wish to style from the layers menu.

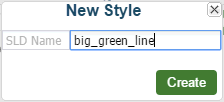
Select New Style to add a new style. Enter a name for the new style and select Create.
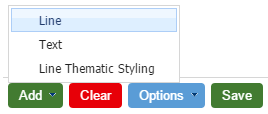
Select Add to add a rule to your style. For this example I will add a line.
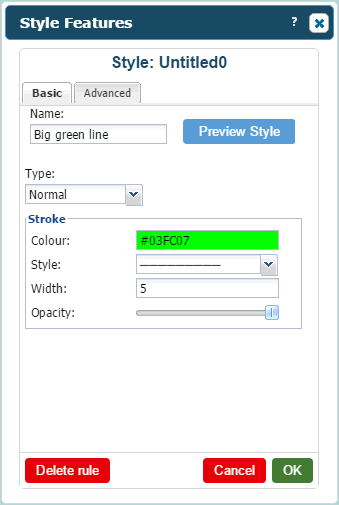
Name - Enter a name for the rule
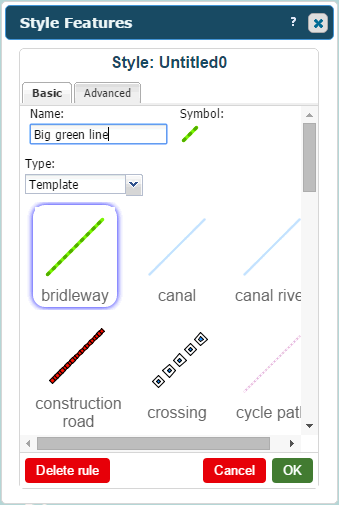
Type - Select the type of style you want
Normal: Define each aspect of the style as you wish.
Template: Choose from a variety of templates.
Select OK to use the template for your style.
If you choose the Normal type as opposed to Template, you can edit the style of your layer as follows.
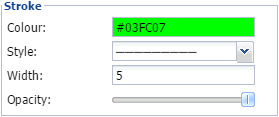
Colour - Select the colour for the feature.
Style - Select what style of line you want for the feature.
Width - Select the width to make the style.
Opacity - Select how transparent/opaque you wish to make the style.
Switch to the Advanced tab for more options.
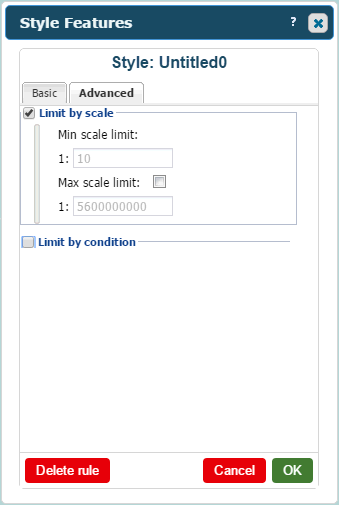
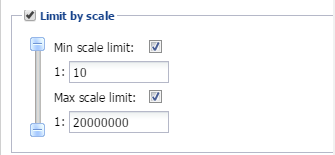
You can limit the scale at which the feature will appear on the map, meaning it will only appear at certain zoom levels.
Min scale limit - The feature will be visible at this minimum scale limit and not if you zoom in any further.
Max scale limit - The feature will be visible at this maximum scale limit and not if you zoom out any further.
Similarly you can limit appearances of your features based on their attributes. Check the Limit by Condition checkbox to begin.
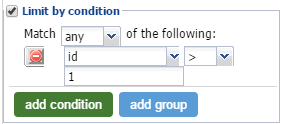
Here you can create a collection of conditions for limiting whether your features appear on the map or not based on their attributes. For each condition you can select an attribute, enter a value and choose whether the attribute must me greater than, smaller than, equal to etc. the value. You can then set the layer to only show features where any, all or none of the conditions are met.
Note: If you didn't add any attributes for the layer, only ID will be available. See Database Table for details on adding more attributes.
Select OK to add the rule to your style. Select Save and it will be applied to the layer and can be used on any other layers of that type you use in the future.
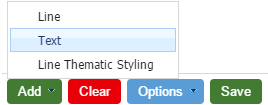
You also have the option of adding text to your layer style.
Select Add to add a rule to your style. Now select Text.
The following panel will come up. The functions are very similar to styling the line previously.
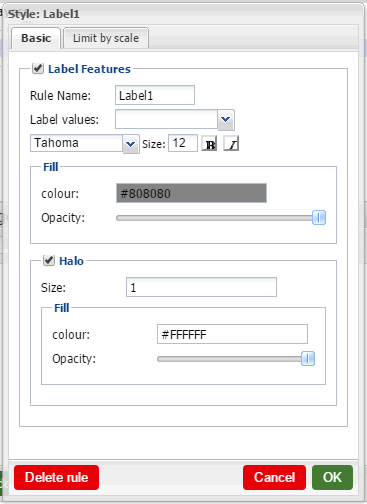
Rule Name - Enter a name for this text rule. One will be entered for you but you can change it if you wish.
Label Values - Select the attribute you wish to display. ID will be your only option if you haven't added any others. See Database Table for details.
Font Settings - You can change the typeface of the text as well as the size and whether it's bold or italic.
Colour - Click to open the colour selector and assign a colour to the text.
Opacity - Use the slider to modify the transparency of the text.
Toggle Halo - You can have a ring of colour surrounding your text to help it stand out more. This can be toggled here.
Halo Size - Changes how large the halo is.
Halo Colour - Change the colour of the halo.
Halo Opacity - Use this slider to change the transparency of the halo.
The Limit by Scale options are also available for text. They work the same as with the line example above.
Click OK and then Save to add this rule. Every line you draw for this layer will now display its ID in the chosen text around the centre of the feature.
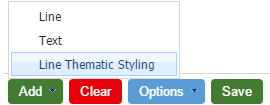
The third option for styling a layer is Thematic Styling. This will colour your features differently depending on a value that's assigned to them. Select Add again and in the case of this example Line Thematic Styling will be one of the selections. Select it but be aware that this will remove all rules already applied to the layer. Confirm this on the pop-up that appears to move on.
The following panel will appear with the Setup tab active.
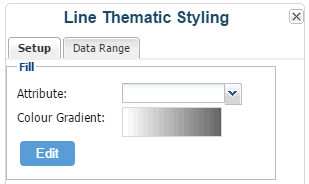
Attribute - Choose the value that will be represented by the colour of each feature. ID will be your only option if you haven't added any others. See Database Table for details.
Colour Gradient - This shows the range of colours that can be assigned to your features.
Click Edit to if you want to change the colour gradient and you'll be presented with the following screen.
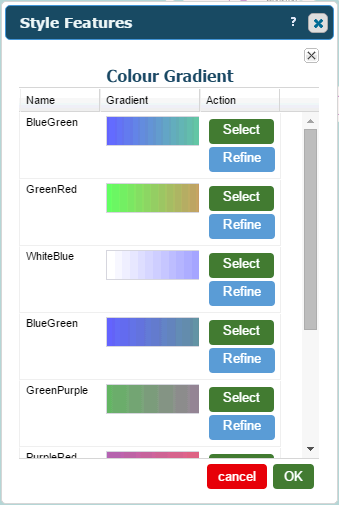
If you're happy with one of the gradients from this list simply click the Select button next to it to use it. You can also click the Refine button to customise it. This will bring up the following.
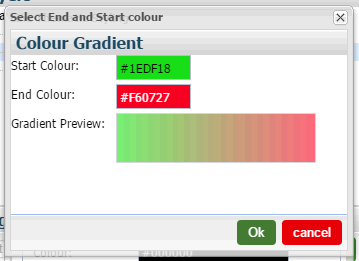
Select your Start and End colours and the range that can be applied to your features will appear in the Gradient Preview. Click OK to continue.
Select the Data Range tab.
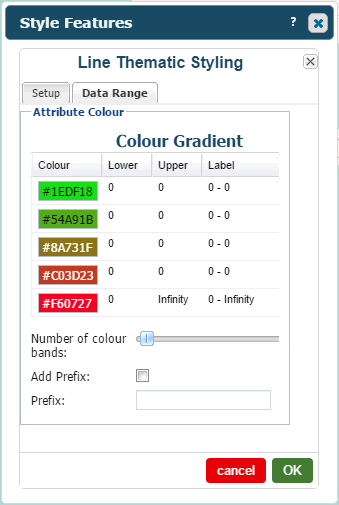
Here you can assign colours to features based on the chosen attribute, in this case ID. Fill in the Lower and Upper fields and every feature with an ID in this range will appear in that colour. So for example if I filled in 1 and 5 for Lower and Upper respectively on the first green colour, the features with ID 1, 2, 3, 4 and 5 will appear in that colour. The label column will automatically change to show this range as well. You can use the Number of Colour Bands slider to add more colours if needed. You can use the Prefix sections to add text that will appear at the start of every label. Check the Add Prefix box to use this feature and enter your desired text into the text box below. Click OK when you've finished.
Finally click Save on the Style Features panel to confirm your new layer.
All the steps listed here are very similar for polygon and point layers but with some minor differences. For example polygons have the option of modifying the fill colour, transparency etc. as well as the line style. Line styles don't have a fill at all and you just change the style of the line itself. They all therefore use different templates as well.
Note: You cannot modify the default point, line and polygon styles.
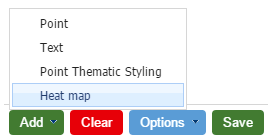
There is one more option for styling a layer that only appears for Point Styles. This is Heat Map. These display features more prominently depending on an attribute assigned to them. Click the Add button to select it.
The following will appear.
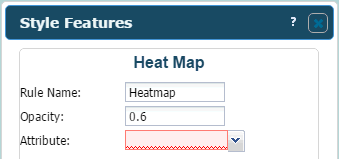
Rule Name - Give your heat map rule a name.
Opacity - Choose how transparent your heat map features will be with 0 being invisible and 1 being fully opaque.
Attribute - The attribute that the appearance of each feature's heat map will be based off.
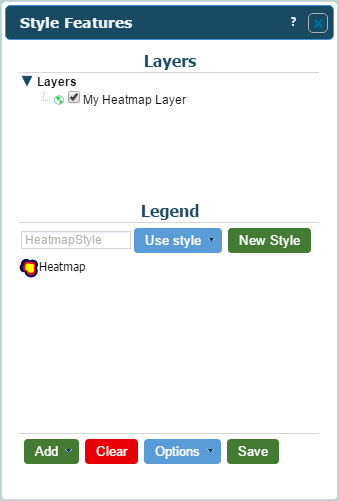
Click OK to continue. Your Heat Map rule will appear in the Styler as shown. Click Save to finalise the changes.
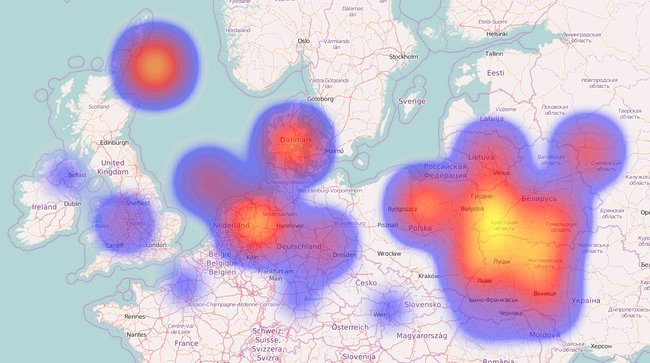
Here is an example of how data from a Heat Map style is displayed.
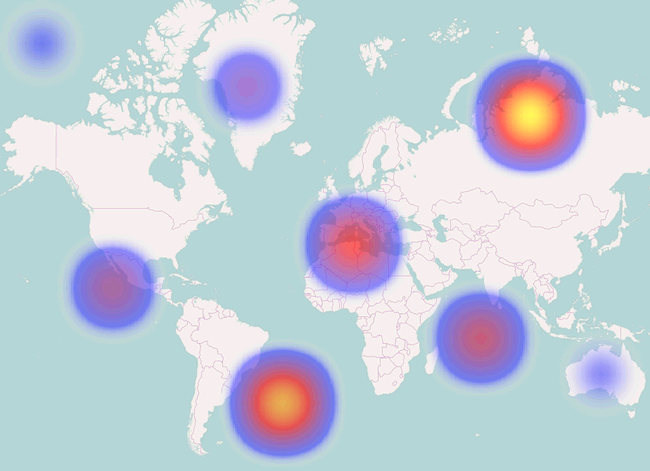
These features have attributes ranging from 1 to 10. The point over Russia was assigned 10 and the one over Australia was assigned 1. You'll notice how the larger value results in a wider and "hotter" Heat Map.
With enough features, Heat Maps will start to merge together to better represent the data.
Note: Remember that Heat Maps only work with Point Styles.